AI calorie counter accuracy report · 2026
Accurate calories from a photo or a few words
Across 30 plates where every ingredient was weighed, DietFit scored 82.0% and was off by just 79 kcal per plate on average. From a few words of text, 88.0%.

- Google Research weighed-food dataset
- USDA reference values
- 644 weighed plates and foods

Photo · head to head
Same plates. Same scoring
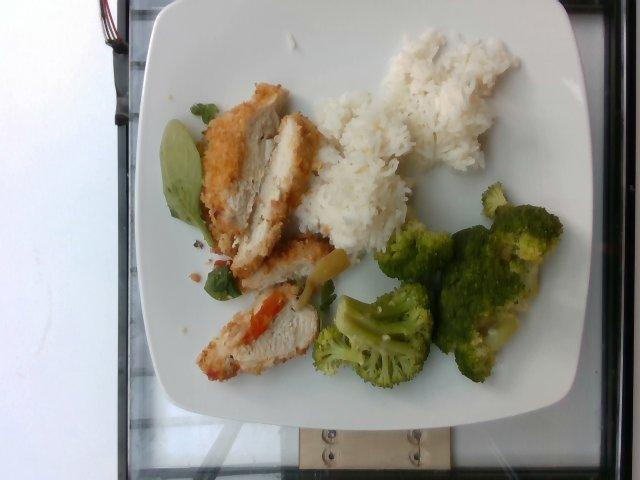
Plus small amounts of parmesan cheese, wheat berry, olive oil, garlic, cherry tomatoes (31 kcal).
- Weighed on a scale
- 404 kcal
- DietFit · 99% accurate
- 399 kcal
Photo accuracy
30 weighed plates chosen by 0xCal
- 1DietFit82.0%Off by 78.9 kcal per plate on average
- 2Cal AI80.0%Off by 80.5 kcal per plate on average
- 30xCal79.2%Off by 81.1 kcal per plate on average
DietFit landed closer to the scale than 0xCal on 17 of 30 plates.
- 01 · Find every food4 foods outlinedDietFit names each food and traces its outline, so nothing is counted twice or missed.
- 02 · Weigh each one115 g · 100 g · 80 g · 5 gFrom each outline it estimates how much of that food is there, in grams.
- 03 · Add it up399 kcalCalories and macros come from each food's nutrition data at that weight, then sum to the meal.
Text logging
#1 on text logging too
0xCal's 107 described foods, scored against USDA values, beside 0xCal's, MyFitnessPal's and Fitatu's published answers.
Text accuracy
107 foods, USDA reference values
- 1DietFit88.0%
- 20xCal87.7%
- 3MyFitnessPal65.8%
- 4Fitatu63.4%
| Category | DietFit | 0xCal | MyFitnessPal | Fitatu |
|---|---|---|---|---|
| Drinks · 2 | 90.5% | 88.6% | 88.6% | 97.3% |
| Dairy · 3 | 100.0% | 99.3% | 88.2% | 93.1% |
| Fast food · 3 | 96.0% | 94.5% | 86.6% | 89.2% |
| Fats and nuts · 3 | 99.9% | 99.6% | 99.1% | 98.4% |
| Fruit · 3 | 100.0% | 100.0% | 83.5% | 91.3% |
| Grains · 4 | 96.3% | 91.4% | 86.0% | 92.8% |
| Home cooking · 12 | 82.6% | 82.4% | 67.7% | 67.8% |
| International · 12 | 84.7% | 79.6% | 66.0% | 65.6% |
| Protein · 5 | 92.0% | 100.0% | 91.4% | 92.9% |
| Restaurant dishes · 12 | 86.4% | 88.4% | 63.0% | 65.5% |
| Special diets · 35 | 86.8% | 87.5% | 71.1% | 59.5% |
| Misspellings · 11 | 83.7% | 86.4% | 0.0% | 0.0% |
| Vegetables · 2 | 99.8% | 71.3% | 72.8% | 83.0% |
Methodology
How we test
Three rules, applied the same way to every app on this page, ours included.
Data: Nutrition5k © Google Research, CC BY 4.0 (Thames et al., CVPR 2021); USDA FoodData Central; 0xCal's benchmark data (0xcal.app/api/benchmark).
Weighed truth
Every plate's ingredients were weighed by Google Research, and every described food has a USDA reference value. Nothing is scored against an estimate.
One run, no edits
Each photo goes through the same API the DietFit app uses, each description through DietFit's text analysis. Once, with no retries for a better answer and no manual fixes.
Same formula for everyone
Accuracy is 100 minus the percentage error, averaged per item. It is the formula 0xCal publishes, applied to every app's answers.
Accuracy = 100 − |estimate − weighed| ÷ weighed × 100
Example: 450 kcal estimated for a 500 kcal plate is 10% off, a score of 90.
Questions
Is DietFit the most accurate calorie tracker?
On every test we could run head to head, DietFit is at the top or level with it: 82.0% against Cal AI's 80.0% and 0xCal's 79.2% on 0xCal's own photo test, and well ahead of MyFitnessPal and Fitatu on text. We don't claim "most accurate" outright, because no app publishes enough data to test them all on the same plates.
What does the accuracy score mean?
For each plate or food, 100 minus the percentage error: 450 kcal against a true 500 kcal is 10% off, a score of 90. We report the average across items, as 0xCal does.
Can I check these numbers myself?
Yes. Both test sets are public: Nutrition5k from Google Research, with every plate's weighed ingredients, and 0xCal's published benchmark, with every food and every app's answer.
